- Learning:Crypto
- Posts
- Bitcoin's Rise Asserts Dominance & Do Kwon Faces Accountability!
Bitcoin's Rise Asserts Dominance & Do Kwon Faces Accountability!
Gold, silver, oil rally whilst equities take a breather; macro chart porn warning!
Crypto News
Former TerraForm Chief Found Liable in Civil Court, Braces for Extradition Showdown
Do Kwon, the former CEO of Terraform Labs, faced a damning verdict in a Manhattan civil court last Friday following charges filed by the Securities Exchange Commission (SEC). The allegations centred on Kwon's dissemination of false information to investors regarding the stability of Terra's algorithmic stablecoin, Terra USD (UST). The collapse of UST in May 2022 resulted in a staggering loss of $40 billion for Terraform, leading to the demise of both the stablecoin and the company itself. This debacle sent shock waves through the cryptocurrency sphere, precipitating a significant black swan event.
The nine-day trial meticulously examined evidence from both parties, ultimately concluding that Kwon and his company had misled investors regarding the functionality of the stablecoin technology. Typically pegged at a 1:1 ratio to a fiat currency such as the USD, a stablecoin is a digital asset designed to maintain a fixed value. However, in this instance, UST experienced a drastic de-pegging against the USD, plunging the cryptocurrency market into chaos.
According to the SEC, Terraform Labs falsely portrayed having mechanisms in place to restore UST's value to parity when, in reality, they relied heavily on large investors to stabilise the coin's price. The selling pressure from these investors triggered a sharp decline, leaving Terraform Labs without adequate collateral to weather the storm. Notably, Jump Trading, a significant investor, attempted to assist in restoring UST's stability, but Terraform Labs chose to keep this intervention clandestine.
Terraform Labs contended that it was common practice for large investors to assist in restoring a stablecoin's parity, but the jury unanimously found Kwon and his company guilty on all charges. Kwon's absence from the civil court proceedings was due to his current whereabouts in Montenegro, where he faces potential extradition to the U.S. and South Korea to answer criminal charges.
Bitcoin Cash Skyrockets 10% After Epic BCH Halving Event
Bitcoin Cash (BCH) recently underwent its own halving, occurring just weeks ahead of Bitcoin's highly anticipated halving event. Following this development, the price of BCH surged by 10%. Halving in the context of Bitcoin and BCH refers to the reduction of rewards for miners who process transactions. This reduction occurs as the block reward is halved, diminishing from its previous value to 3.125. Consequently, the pace of coin creation decreases, resulting in a reduction of circulated Bitcoin.
This halving event is a cyclical occurrence, repeating every four years. The upcoming Bitcoin halving is scheduled for April 29th, 2024. Historically, Bitcoin experiences significant surges in value following halving events, and this year's event may uphold that trend, despite recent sideways movement in price. Notably, during the previous halving, Bitcoin's price skyrocketed from its low of $3,850 in March 2020 to a staggering high of $69,000 in November 2021, marking a remarkable 1692% increase within a mere 20-month period.
However, after this impressive rally, the cryptocurrency market endured various setbacks. These included instances of illegal activities within the cryptocurrency realm and the over-leveraging of companies associated with the industry. Consequently, the market underwent a year-long bearish phase before finally bottoming out at $15,479 in November of the preceding year.
Despite recent retracements within the ongoing bull market, many within the cryptocurrency community remain optimistic. There is hope that the forthcoming halving event will catalyse another substantial bull run, potentially yielding comparable percentage increases to those witnessed in previous Bitcoin halvings.
Crypto Derivatives Trading Soars To New Highs, Spot Trading Takes Lead
Cryptocurrency derivatives soared to a record high of $6.18 trillion, experiencing an impressive surge of 86.5% on centralised exchanges. However, amidst this surge, there was a noticeable decline in the overall percentage share of the cryptocurrency space, which dropped to 67.8%. This marks the sixth consecutive month of such a decline.
Derivative trading involves speculative activities, where traders either sell (short) or buy (long) futures contracts based on their anticipation of the future movement of the asset being traded. The decline in the derivatives market can largely be attributed to the sustained demand for spot Bitcoin. Spot Bitcoin witnessed a significant uptick of 16.6% in March, driven primarily by the introduction and subsequent approval of Bitcoin Spot ETFs.
This surge in spot Bitcoin trading led to a remarkable milestone as Bitcoin shattered its previous all-time high of $69,000, soaring to $73,794 on March 14th. Consequently, cryptocurrency spot trading reached $2.94 trillion in March, combining with derivatives trading to achieve a record-breaking total of $9.12 trillion.
Cypto Analysis
Bitcoin (BTC)
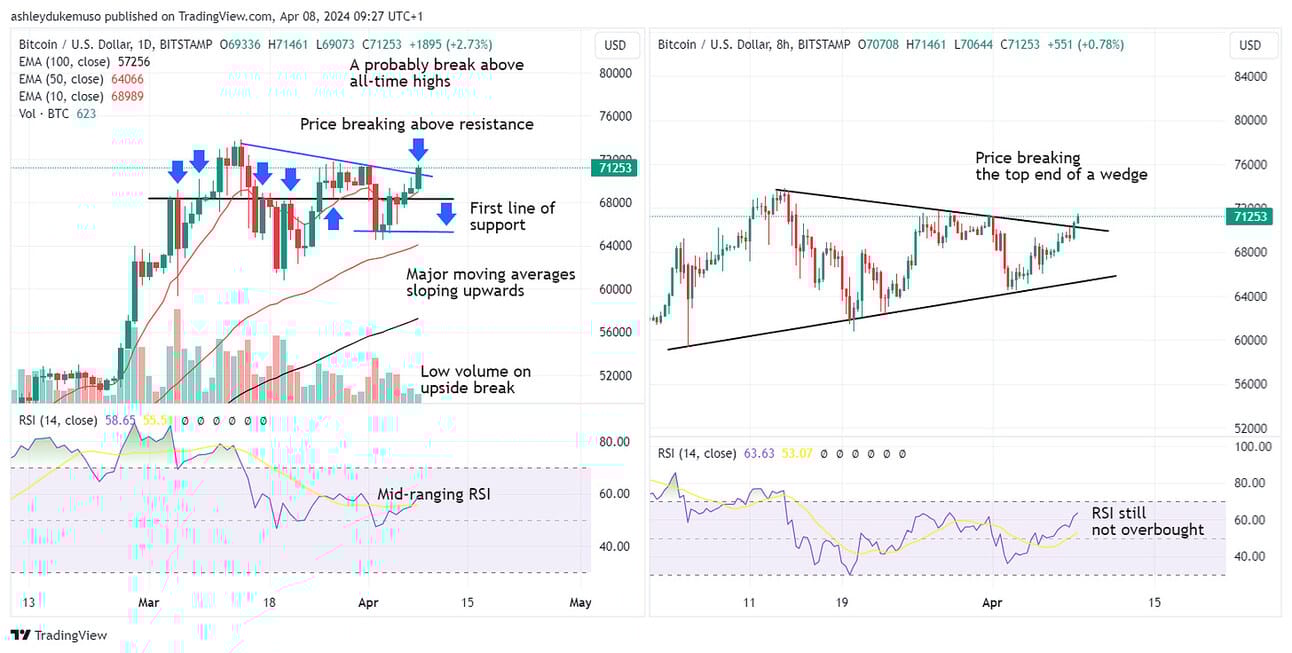
Bitcoin, the world’s largest digital asset globally in terms of market capitalisation, was wrapping up the week on a positive note, nearly regaining its initial position it began at the start of the week. A bullish pin bar was observed on the weekly chart, a topic we'll explore momentarily. At the time of writing on early Monday morning, Bitcoin was currently at $71,134, breaking daily resistance and moving swiftly towards the highs of the week before. At this point, a retest of all-time highs is very likely although not inevitable.
Our primary analysis begins with the daily chart. At the onset of the week, we witnessed a couple of red candles, with Tuesday's price experiencing a 6% decline, followed by Wednesday, which formed a slightly lower-low taking price down to $64,511 which marked the bottom. However, the market recovered, almost reaching the initial week's price level, indicating an influx of long positions outweighing short trades, thus finding value at the lows.
Notably, the price has smashed through the 10-day exponential moving average and resistance, indicated by the upper black horizontal line approximately at $68,360.This level has been tested several times over the past month, exhibiting volatility. Despite the recent upside movement, volume remains weak, a factor to be cautious of, particularly considering the weekend timing.
The RSI is mid-ranging, suggesting that price has the flexibility to move in either direction. A definitive trend change would occur with a break below the blue horizontal support line around and swing low at $64,511, marking the first significant daily lower-low, at this moment in time seems unlikely to visit that region.
On the 8-hour chart, a wedge pattern has emerged, with the current price breaking above that resistance line. Notably, multiple successive green candles were imprinted on the chart. A break above this point is now seen as a highly bullish sign and makes a return to the all-time highs probable. Again, warrant all price action with caution.
The weekly chart reveals two consecutive bullish pin bars occurring one week apart. This pattern typically involves selling pressure driving the price down towards lows, followed by buying activity pushing the price back up to the top of the candle's range. Additionally, we've observed successive bounces off the 0.236 Fibonacci level, traced from the January swing lows up to the recent all-time highs, which are positioned at $69,739.
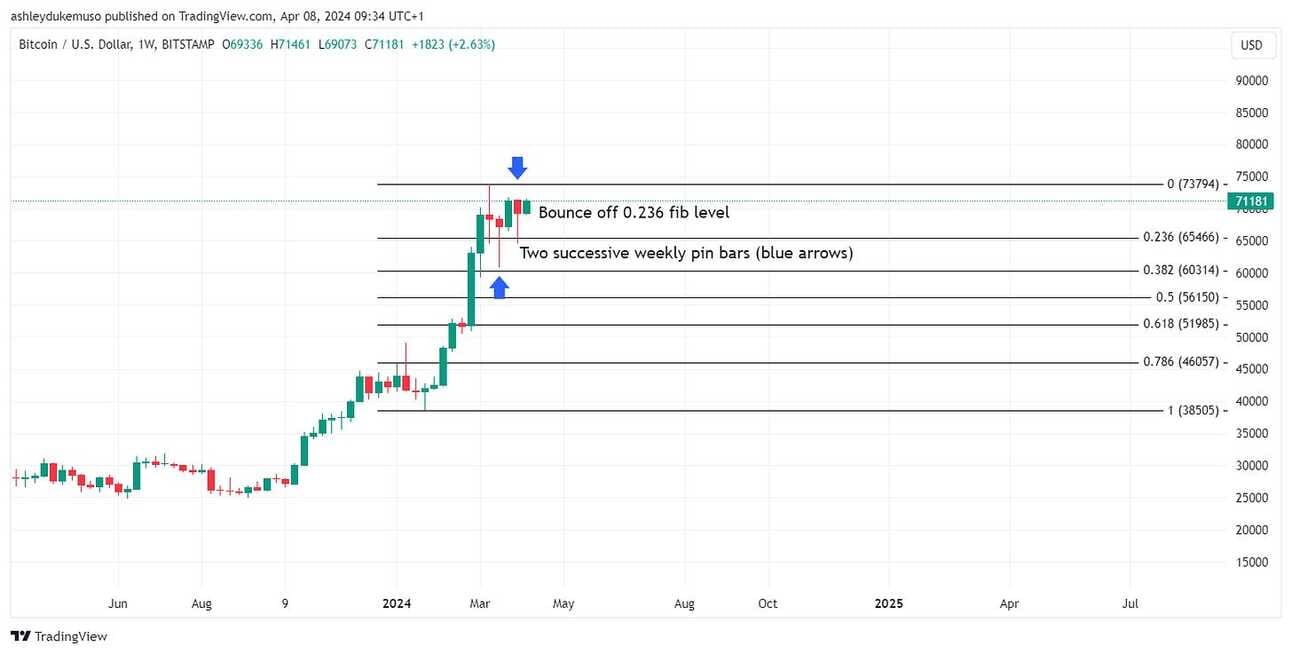
Taking all factors into account, including the potential break of the wedge pattern on the daily chart, the rebounds off the weekly Fibonacci levels, the successive pin bars, and the price resting towards the upper end of the price chart, it appears increasingly probable that Bitcoin has completed its short-term retracement. Consequently, an attempt to reach all-time highs is becoming more likely. However, in the volatile realm of cryptocurrency, nothing should ever be assumed. I eagerly anticipate revisiting the Bitcoin chart next week for further insights.
Total 2 (All Altcoins)
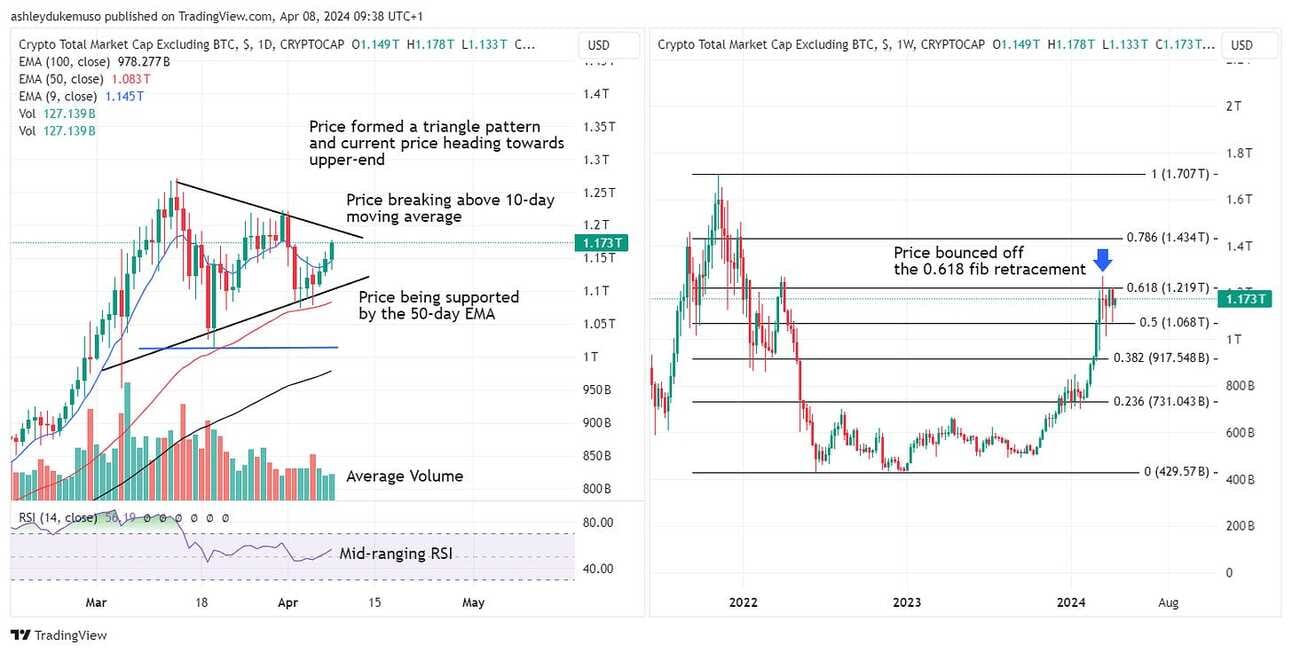
The Total 2 chart, covering all altcoins, is our second choice for the week. The chart shows a triangle pattern formed, with highs decreasing and lows increasing. This is indicative of a market that has been showing mid and high-cap altcoins performing in a chaotic and unpredictable manner. Guessing the breakout direction is challenging due to the contracting price, requiring a careful judgement call based on comprehensive analysis. The anticipated breakout level is around $1.09 trillion.
On the positive side, the primary trend is upward, with movement above the 100 and 50-day exponential moving averages and recent strong green candles. Additionally, the weekly chart indicates a series of higher highs, suggesting an upward trajectory. However, caution is necessary as warning signs emerge.
Looking at the chart, the negatives cover the formation of the triangle pattern indicating a daily lower low. Price movement suggests sideways action around the 10-day EMA. For the better part of the week, there had been significant declines marked by large red candles, signalling negative sentiment which has since recovered and we have to take a closer look if and when price touches the top of the triangle.
While daily support remains unbroken, breaking below the blue horizontal line at $1.141 trillion would move the price below the 50-day EMA, potentially signalling a bearish medium-term trend. The weekly chart shows a significant bounce off the 0.618 Fibonacci retracement level from the November 2021 all-time high of $1.70 trillion to the June 2022 lows of $429.57 billion, registering at $1.219 trillion. This level was tested twice before being rejected.
The Total 2 chart exhibits a more bullish outlook on early Monday morning than it did over the weekend. Further short-term developments will be pivotal in determining whether this signals a more assertive push towards the apex of the triangle pattern and another retest of that all-important 0.618 Fibonacci weekly retracement.
Bitcoin Dominance (BTC.D excluding major stablecoins)
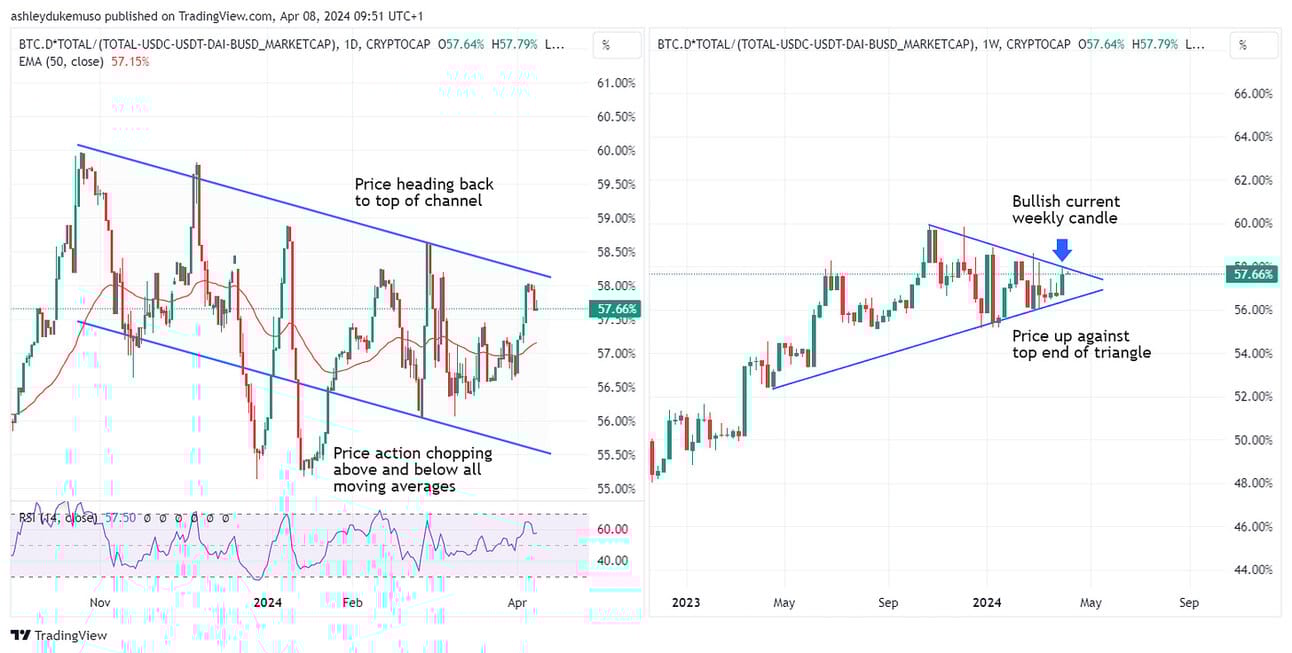
In our concluding analysis of the week, we turn our attention to Bitcoin Dominance versus altcoins, excluding major stablecoins. It's apparent that Bitcoin is surpassing altcoins, as Bitcoin gains ground while altcoins lag behind. Some may question the parallel trend channel I've illustrated, particularly with its broken lower trendline. However, such occurrences are not uncommon, as prices often revert to the channel's parameters, as evidenced on the daily chart to the left below.
Presently, we find ourselves back at the upper boundary of the channel, with Bitcoin positioned to revisit all-time highs. Furthermore, the weekly triangle pattern depicted on the chart to the right is nearing a breakout, suggesting growing evidence that Bitcoin is poised to reassert its dominance after weeks of sideways consolidation. A breakout and subsequent close above the triangle pattern, around the 58% mark, could potentially propel Bitcoin dominance even higher.
In Summary
Bitcoin appears to be holding steady, but the overall health of the altcoin market tells a different story, which has been rather disappointing over the past few weeks. Many altcoins are far from their all-time highs, and there are concerning signs indicating weakness, with several assets poised to test support levels. Despite this, certain sectors within the altcoin space, such as real-world assets (RWA) and meme-coins, have demonstrated resilience and a few other mid and high-cap assets.
Throughout this bull market, we've consistently emphasised that the primary trend is upward. However, we've also cautioned against potential topping patterns, which may be emerging now. We must see a significant bounce soon in altcoins, not just a temporary respite, but one marked by strong bullish candles. Failure to achieve this could signal a larger retracement for altcoins, necessitating the identification of more significant downside levels.
Wishing everyone a happy and productive week ahead.
Macro Analysis
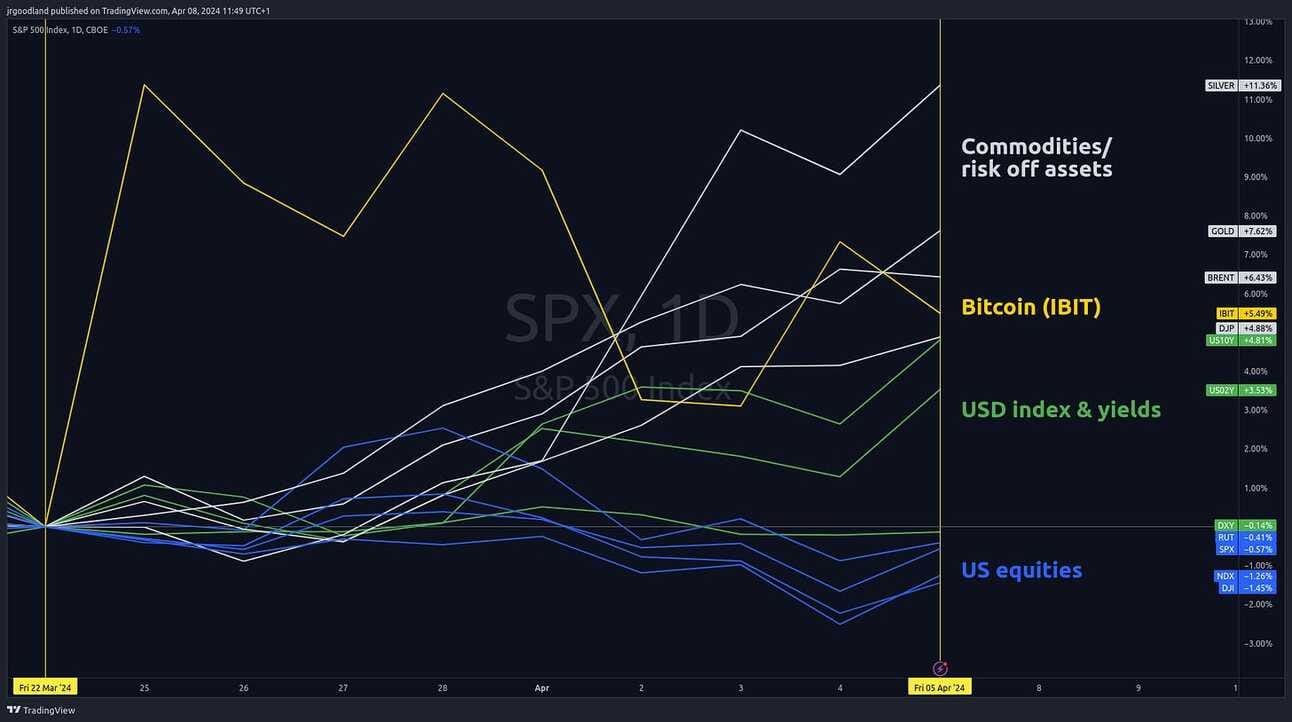
Last week was mixed for equities and FX, with commodities, yields and bitcoin all rising during a busy week of Fed speak. Brent crude broke $90 and the 10 year yield closed at 4.4%, its highest since November last year. Rising yields generally indicate risk off and this was reflected in equities, however it’s very encouraging to see bitcoin behave more like commodities.
Cautious Fed speak, rising oil prices and uncertainty over Friday’s US jobs data caused a sharp sell off across equities. All three major US indices gapped up on Thursday but sold off heavily in the afternoon session, to close the day significantly lower than the previous day’s candle. This created an engulfing candle pattern, where the candle body (from open to close, ignoring wicks) completely overlaps, or engulfs, the previous candle(s). An engulfing candle whose close is higher than its open is known as a bullish engulfing candle, and where the close is lower than the open it’s a bearish engulfing candle. Such patterns, along with very gappy price action, tend to indicate turning points so a bull market correction (~3-10%) over the coming days and weeks wouldn’t surprise me.
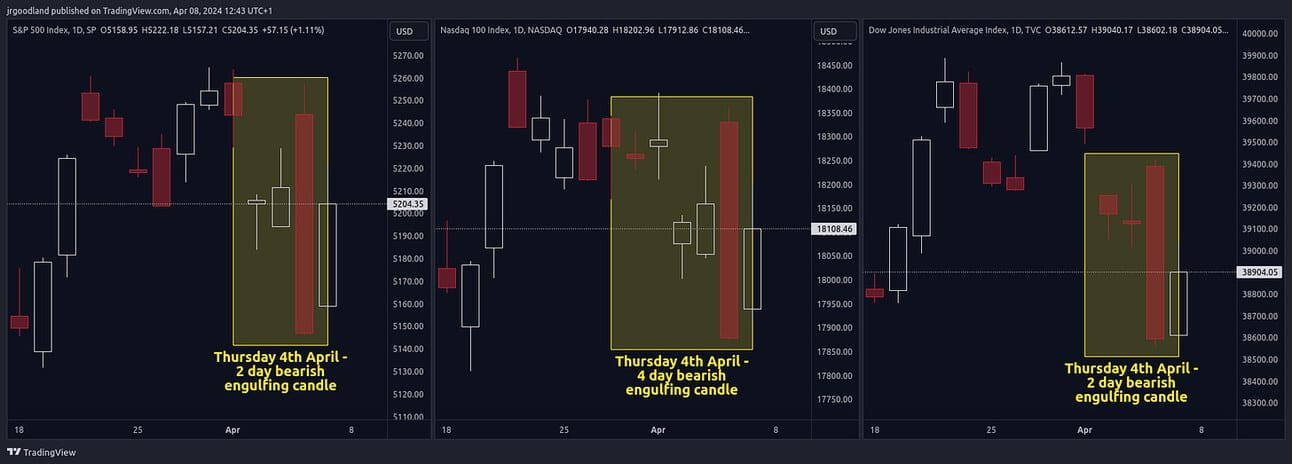
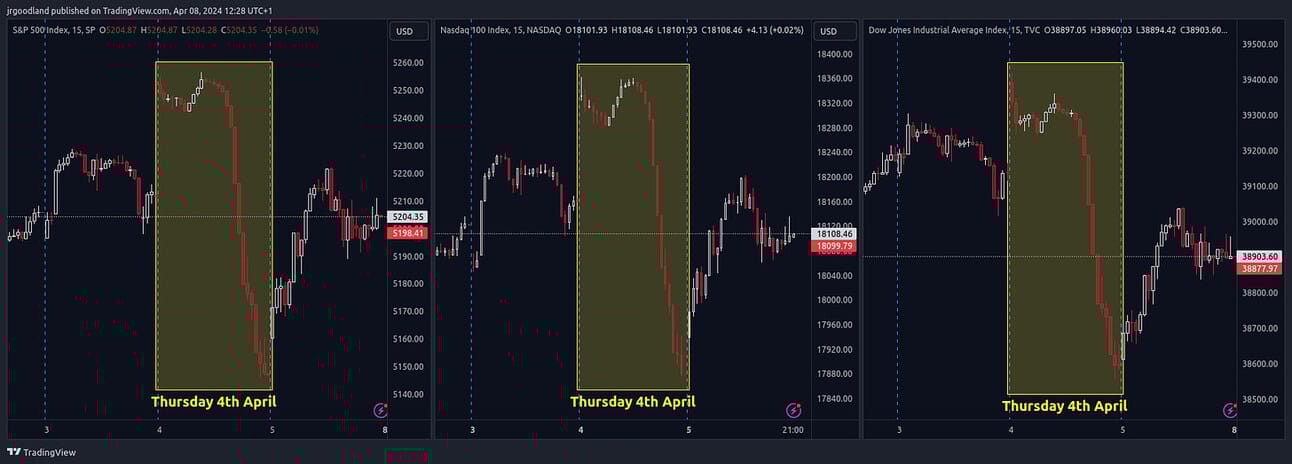
The charts above show the daily engulfing candles and charts below show the intraday selloff. Whilst Thursday saw a violent move, much of this was re-gained on Friday.
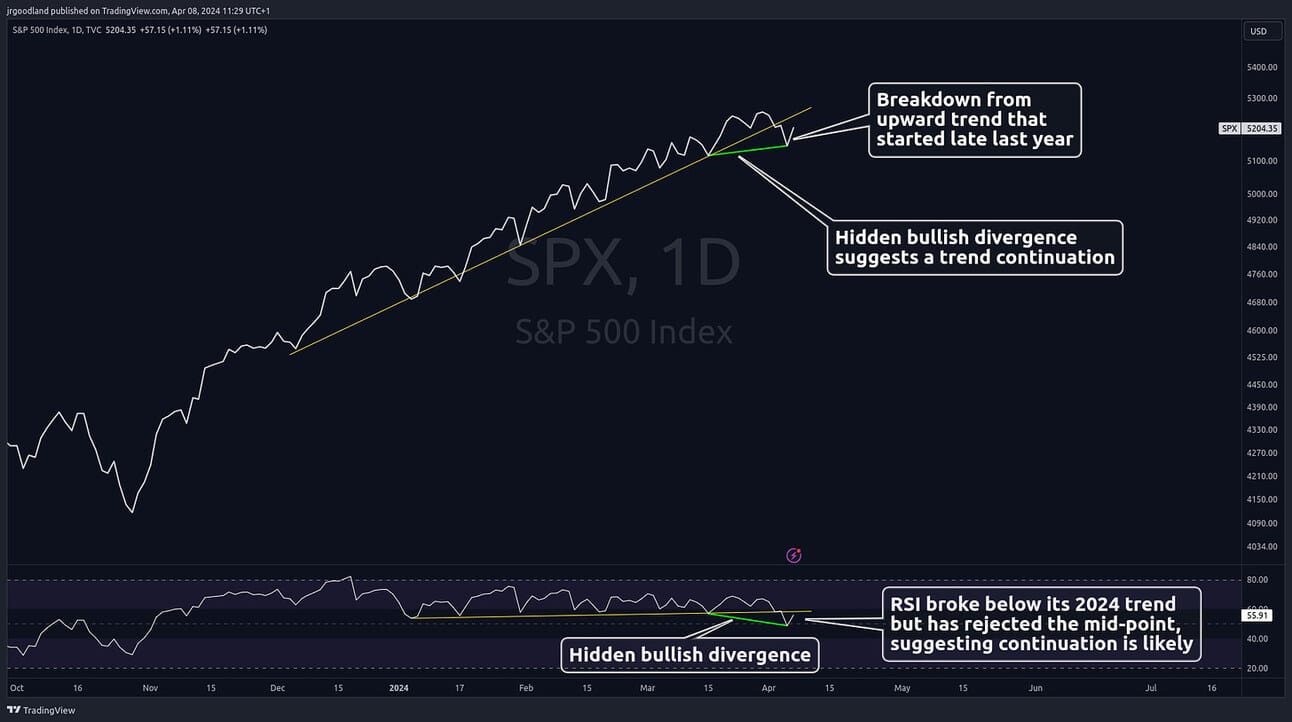
This sell off also caused the S&P 500 to break out of its upward trend to create a lower low on the daily chart. Again, this could be a sign of short term weakness, but there’s more bullish news. Thursday’s sell off, and Friday’s higher close, have printed a hidden bullish divergence which is a trend continuation pattern, and the trend is definitely up! Whilst the daily RSI also broke below its year to date trend line, it has encouragingly bounced off of its mid-point to confirm the bullish case.
Macro News
US Employment Data
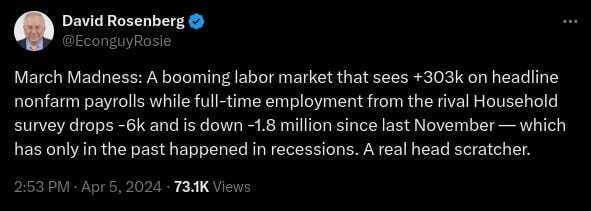
As discussed above, the market braced for a strong jobs report on Friday. Indeed, the headline figure – 303,000 vs expected 200,000 – was a very strong beat. So why did the market rally on Friday? The bulk of this recovery was a natural reaction to the previous day’s big move down, and this recovery happened ahead of the jobs report. But there wasn’t much of a reaction once the nonfarm payroll data was released, probably because although the headline number was a massive beat, as David Rosenberg points out, under the surface the report isn’t as strong as headlines suggest.
Marko Bjegovic posted a thread, breaking down the reasoning behind David Rosenberg’s observation.
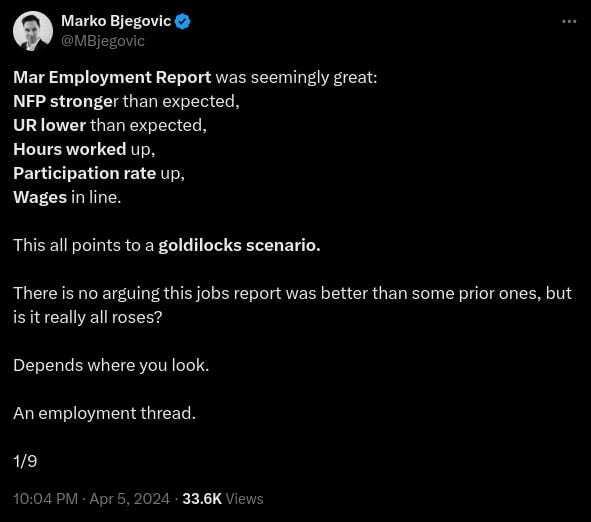
Marko’s thread does a good job of explaining why the headline number of 303k new jobs is misleading. I’ll summarise Marko’s analysis here but he includes many charts and I suggest reading the thread linked above.
NFP numbers were revised down 9 out of 14 months since January 2023, totalling -229k jobs.
Private payrolls were revised down -419k with only 2 significant upward revisions over the same period.
Total NFP and private jobs mostly revised down whilst government jobs mostly revised up. The US government added +903k jobs since January 2023, one of the largest increases on record. Does someone want re-electing this year, perhaps?…
Over the last 12 months, the establishment (NFP) survey added +2.927 million jobs but the household survey only added +642 thousand jobs, and importantly full time employment declined -1.347 million jobs over this period.
Over the last 4 months, full time employment has dropped by a massive -1.787 million jobs which has only previously happened in 2020, 2009, 2008 and 1975. Anyone want to guess what those years had in common?
This is a very different story to the headline +303k jobs created in March. Compare many of these data points to prior periods with similar numbers, and you easily see why the recession calls continue as strong as ever.
Maybe the recessionistas have a point. Or, as Jim Bianco has been saying for some time now, maybe the post-covid economy has changed, and the recessionistas are actually missing the point. As Bianco says, different does not mean bad. The covid lockdowns made many people reassess life priorities, with work from home statistics still not back to pre-pandemic levels. Perhaps the increase in part time work and multiple jobs is an indication of changed work preferences and devoting more time to family, friends and travel. That’s not necessarily a bad thing, although I think big bank bosses – with commercial real estate heavy balance sheets and half empty office buildings to pay for – would probably tell you otherwise.
Gold, Silver, Miners Outperforming
Gold and silver have been on a superb run since late February, up over +14% and +21% respectively. The mining indices have finally woken up as well, with gold miners (GDX) having gained +28% and silver miners (SIL) up +34% over the same period.
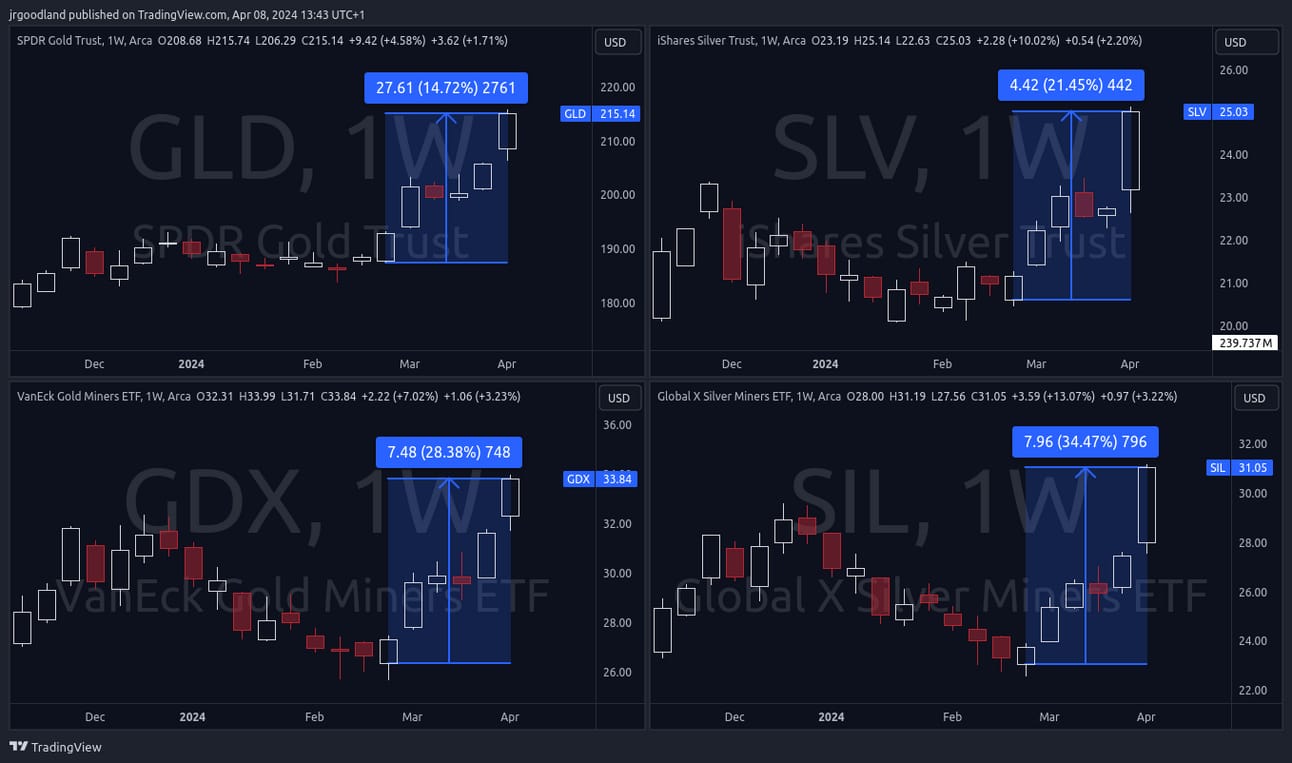
This is unusual, given real rates have remained high, which is usually a headwind for gold and silver because precious metals are non-yielding assets. If you can get yield elsewhere (Treasuries, dividend stocks, debt) then why hold gold? There are various rumours/reasons going around the gold and silver X communities but one thing is for sure: since Russia’s assets were frozen following their invasion of Ukraine, central banks of non-US friendly countries have been stacking significant amounts of gold, and repatriating their gold reserves held in Western territories.
Summary
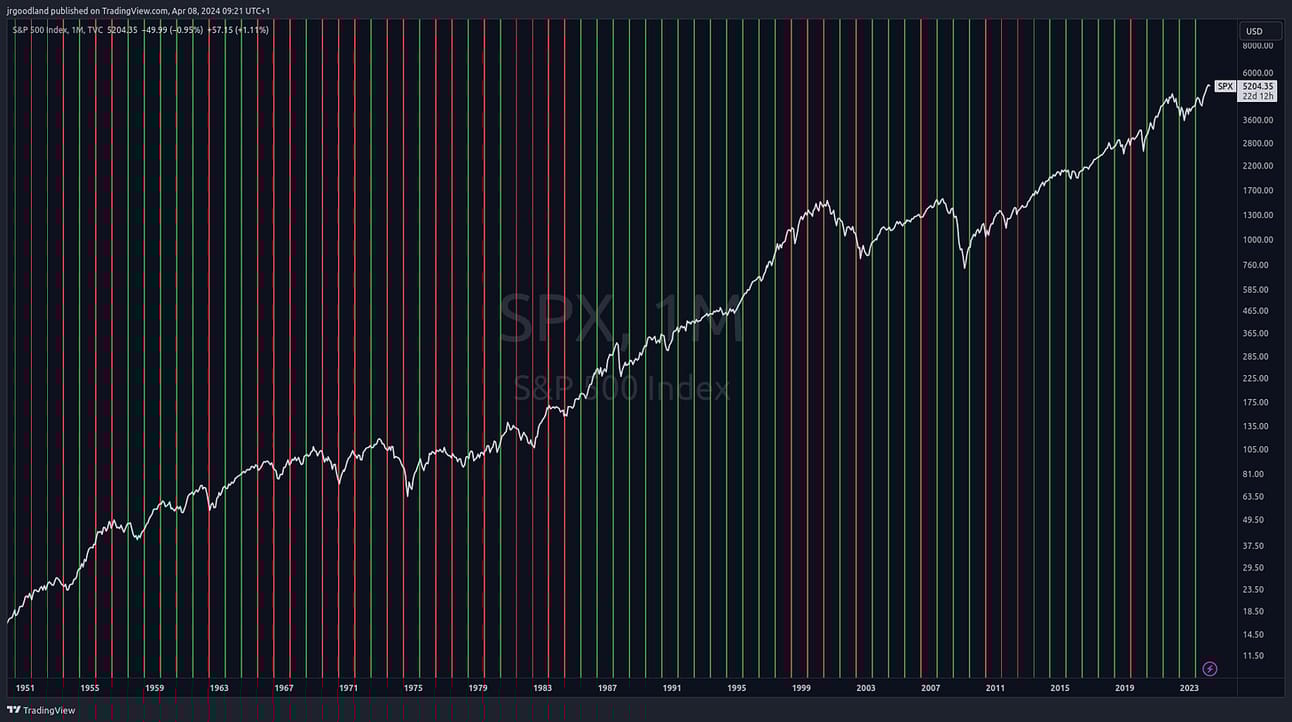
Currently everyone thinks they’re right. Bonds, stocks, gold, silver, bitcoin… everyone thinks their thing is going to the moon. But the recession talk hasn’t disappeared. Whilst every asset class appears to be over crowded, my thinking is that this will continue for the rest of this year and throughout 2025 as momentum is strong and government spending isn’t stopping. Nothing goes in a straight line though – there will be corrections which likely will be scary and test investors’ resolve. But until the fundamentals (largely government spending & unemployment) change, I don’t see why the trend changes. If in doubt, zoom out. The only caveat I’ll add is the Wall St saying, “sell in May and go away”, although looking at the S&P since 1950 that appears to have been true through the 60s & 70s but not such a good decision overall!
This week we have US inflation and CPI data on Wednesday, then later on Wednesday we also have the FOMC minutes which may come out more hawkish than the market would like, in line with last week’s Fed speak. Everyone is expecting rate cuts, but nobody knows when it will happen. I expect this will lead to increased volatility, particularly around important data releases, until the next FOMC meeting in June.
The Week Ahead
Economic Calendar
Monday
Israel rate decision
Germany balance of trade, exports
Germany, Turkey industrial production
US Treasury Secretary Janet Yellen meeting with PBOC Governor Pan Gongsheng
BOE Breedon speech
Tuesday
Australia Westpac consumer confidence, NAB business confidence
Japan consumer confidence
China aggregate financing, money supply, new yuan loans
France balance of trade
Mexico inflation
US RCM/TIPP economic optimism index
Fed Kashkari speech
Wednesday
BOJ Ueda speech
New Zealand rate decision
South Korean parliamentary elections
Brazil, Russia inflation
Italy retail sales
US FOMC minutes, wholesale inventories, CPI, 10 year note auction
Canada interest rate decision, policy report, press conference
Fed Bowman, Goolsbee speak
Thursday
China PPI, inflation
Eurozone ECB rate decision
Italy industrial production
Brazil retail sales
US PPI, initial jobless claims, 30 year bond auction
Russia balance of trade
Fed’s Williams, Collins, Bostic speak
BOE’s Greene speech
Friday
Korea jobless rate, rate decision
Singapore GDP, monetary policy statement
Japan industrial production
China balance of trade, imports, exports
Germany, France, Spain inflation
Argentina CPI
UK GDP, goods trade, industrial production, manufacturing production
US import/export prices, University of Michigan consumer sentiment
BOE’s Greene speech
Fed’s Bostic, Daly speak
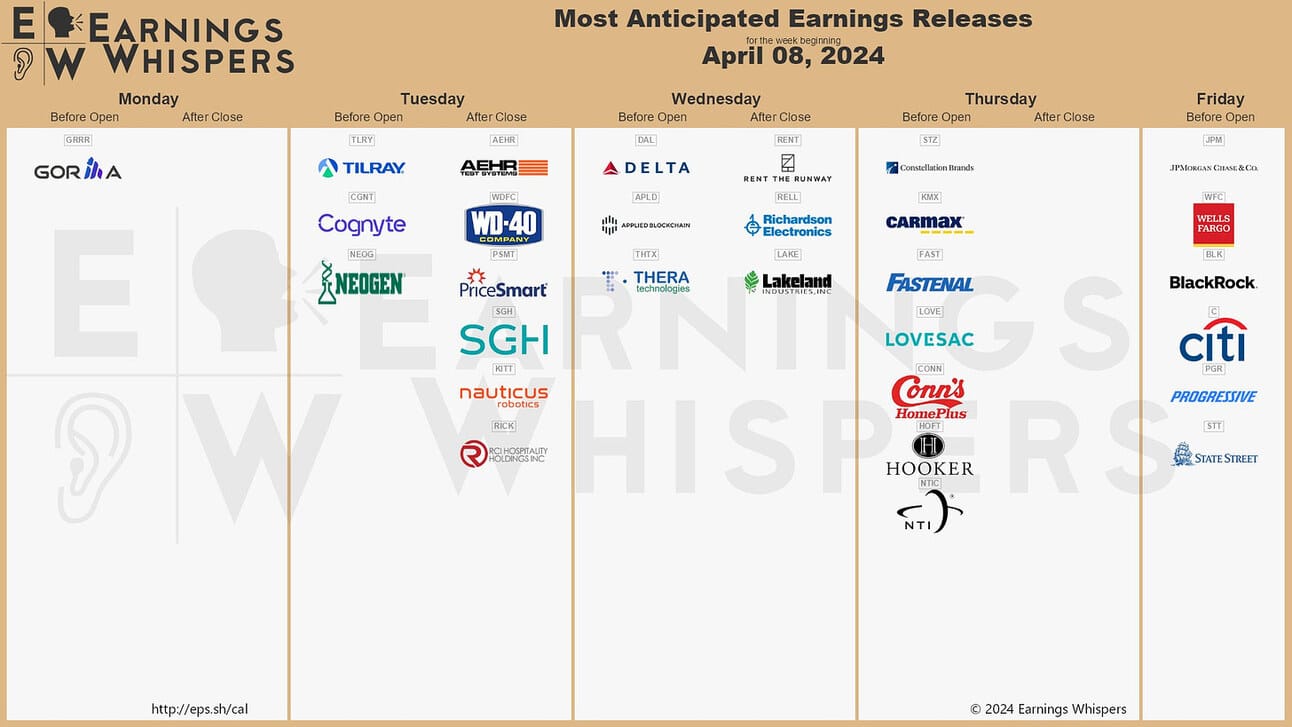
Earnings Calendar
Reply